Best Grafana Loki alternative
for reliable, affordable logs.
Loki ties speed and cost to labels: cardinality caps, timeouts, surprise bills.Oodle AI searches every log in one click: no labels, no timeouts, one flat price.
“OpenSearch UX for logs is so much better than Loki. You don’t need any training, and queries are way faster! It’s a no-brainer to switch to Oodle.”
Distacart
Why are teams choosing Oodle AI over Grafana Cloud Loki?
Simple
- Click-based filtering, no LogQL to learn
- Free-text search and full JSON support
- No label strategy or query planning
Reliable at scale
- No 128KB line caps or silent truncation
- Consistent results, no query timeouts
- High cardinality is native, not a penalty
Cost-efficient
- One predictable price, no active-series meter
- No per-user seats
- No tuning required to stay cheap
Oodle AI vs Grafana Cloud Loki, feature by feature
Loki is designed around labels, and that design leaks: cardinality penalties, query limits, and reliability issues at volume are what send teams looking for Loki alternatives.
 Oodle AI
 Grafana Cloud Loki
See the difference on your own logs.
Try the PlaygroundGrafana Cloud Loki pricing vs Oodle AI
One meter versus several. The same log components, priced side by side.
| Component | Oodle AI | Grafana Cloud Loki |
|---|---|---|
| Ingestion | $0.30 / GB | $0.45 / GB |
| Retention | 30d (up to 1 year) | $0.10 / GB retained |
| Log-based Metrics | $0.06 / metric / mo | Billed as active series |
| Queries | Unlimited, no cap | Included (fair-use cap) |
| Dashboards | Unlimited dashboards | Included |
| Alerting | Unlimited alerts | Included |
| Users | Unlimited seats | Per active user |
Oodle AI figures are from oodle.ai/pricing (logs). Grafana Cloud Logs figures are public Pro-plan rates (Jul 2026); usage above the free tier.
What to look for in a Grafana Cloud Loki alternative
Four dimensions separate a real replacement from a lateral move. Here’s where each side lands.
Scalability & performance
Loki indexes only labels, so any search on log content must decompress and scan chunks, and high-cardinality labels flood the store with tiny chunks. Test search speed on raw content, not just labeled streams.
Full-text search on columnar storage: fast at any cardinality, no label planningLabel index only; content searches scan chunks, and high cardinality degrades the storeIntegration capabilities
Your shippers and Grafana dashboards are the investment. A migration is only cheap if the alternative accepts the agents Loki already uses and Grafana keeps working during the switch.
Promtail, Fluentd, Vector, and OTel work as-is; Grafana dashboards keep workingSame agents, tuned and operated by you inside one vendor’s stackCost structure
Grafana Cloud bills logs across several meters at once: ingest, storage, query scanning, active series, and user seats. Predictability, not the per-GB rate, is the number to compare.
One meter: $0.30/GB ingested; queries, retention, and seats includedFive meters: ingest, storage, query scan, active series, and per-user seatsEase of use
Every Loki search starts with LogQL and the right label selector. During an incident the query language is the interface, so the learning curve is an on-call cost, not a training detail.
Click-based filters and free-text search; no query language requiredLogQL everywhere: no free text, limited JSON, steep curve for new engineersSee it in the product
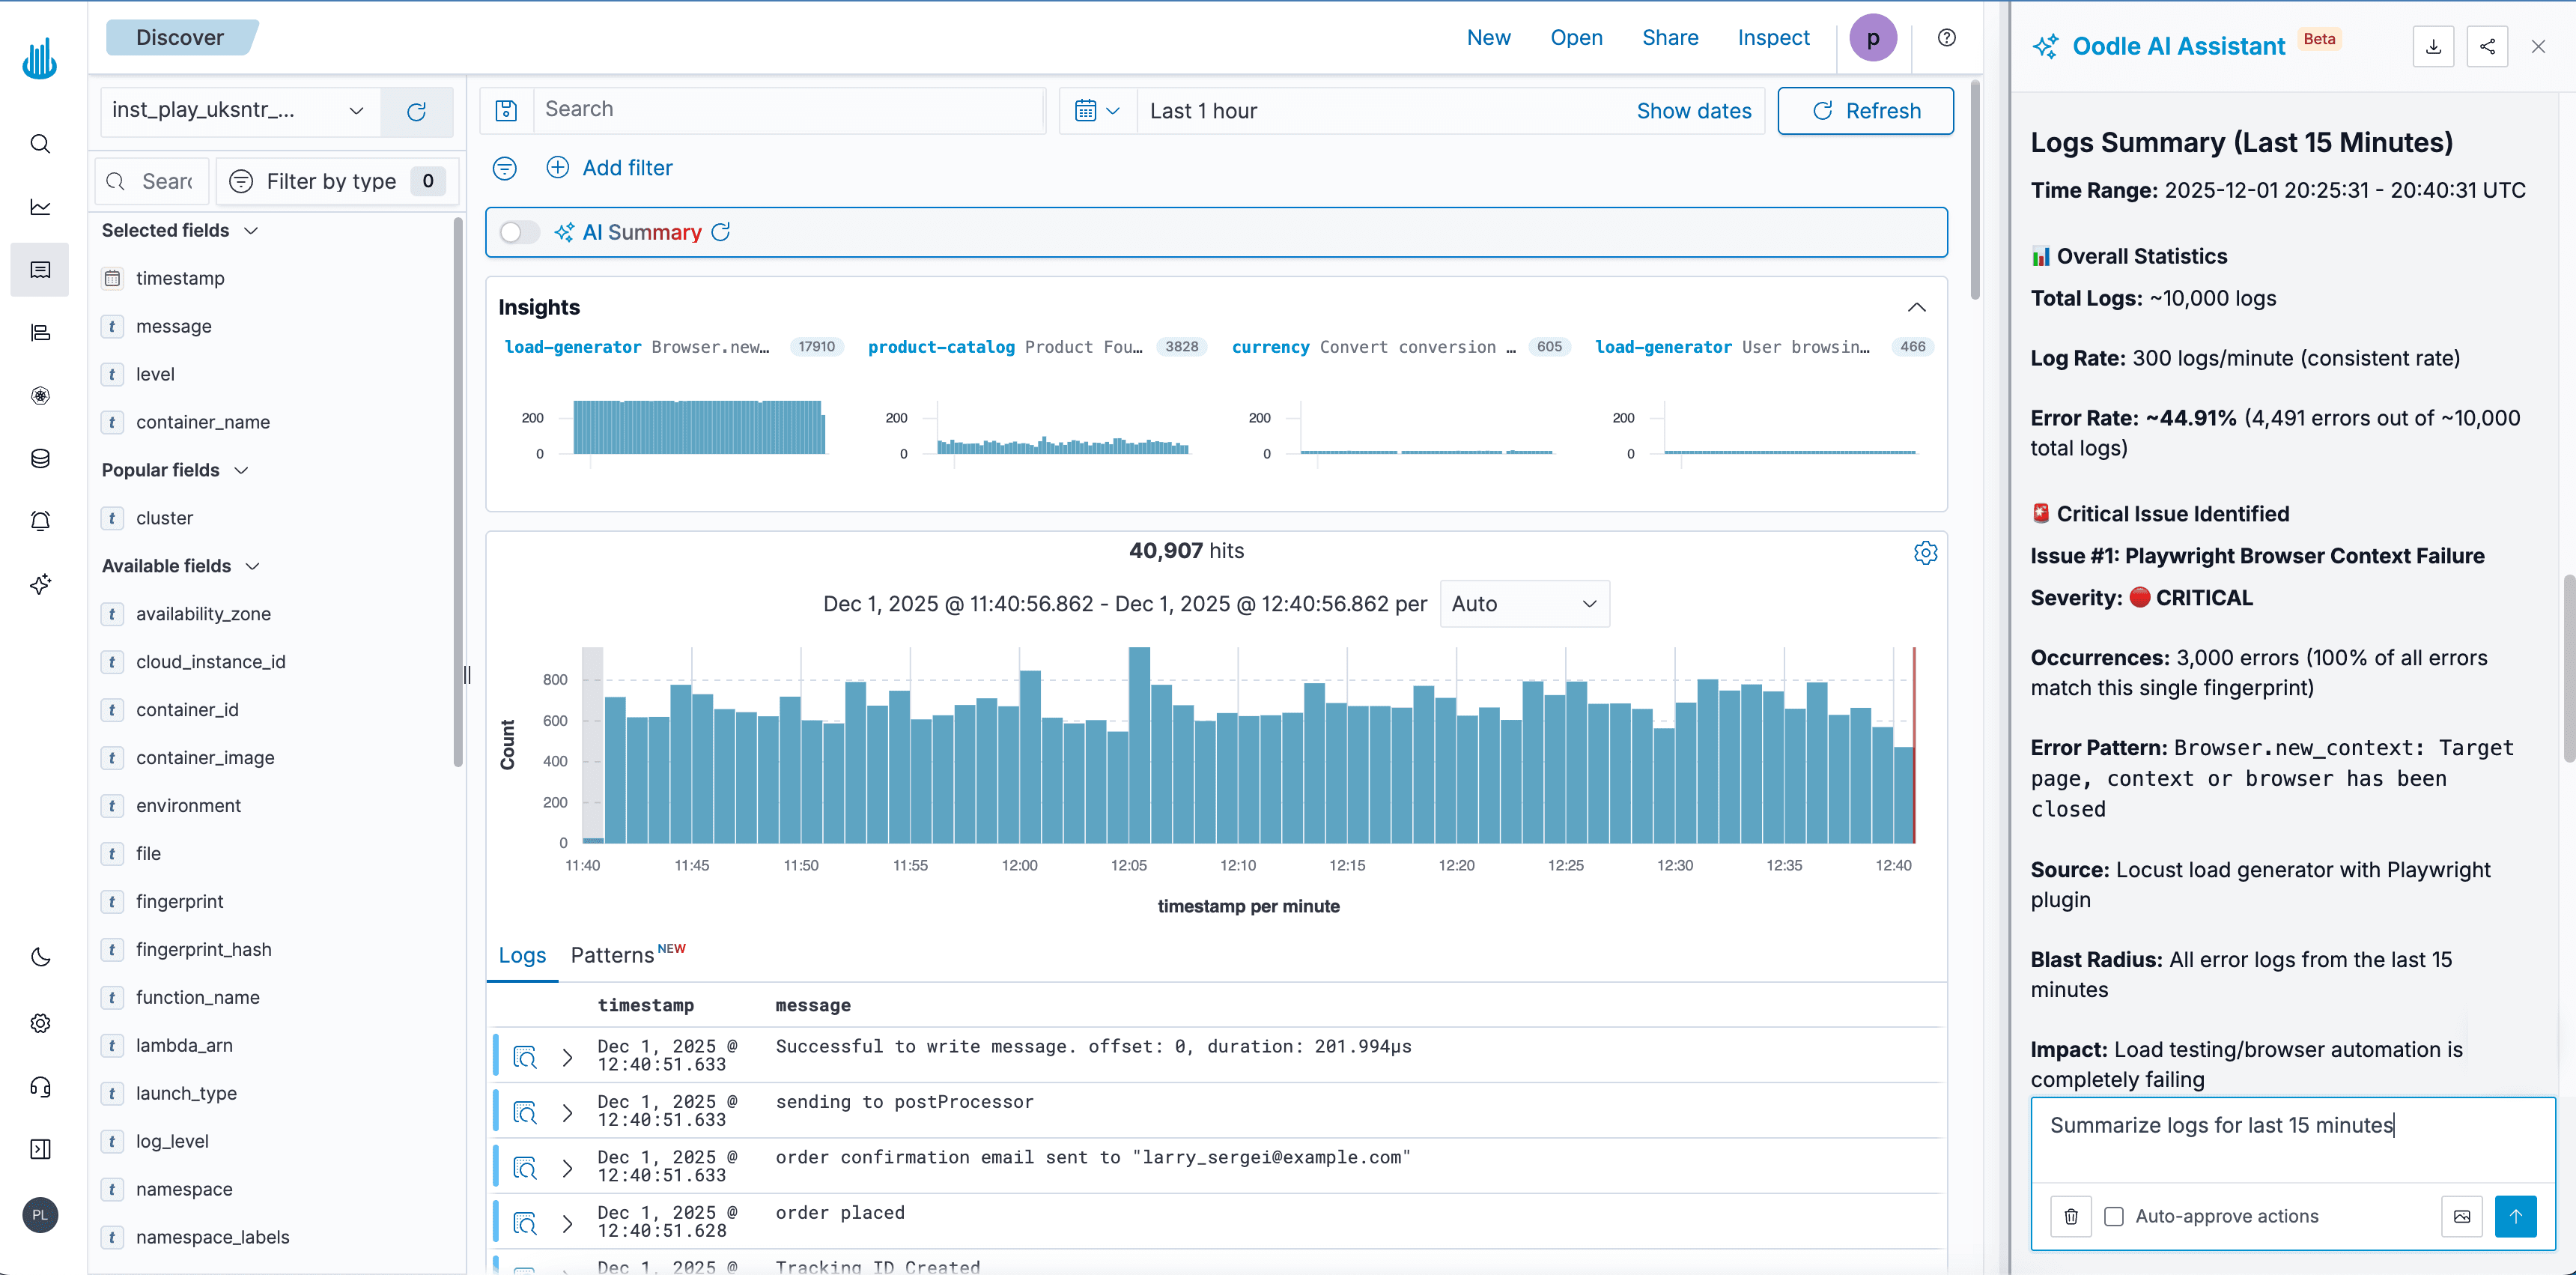
Four Oodle AI capabilities that go beyond label-scoped log storage, no LogQL and no cardinality limits.
Log Patterns
- Auto-group logs by fingerprint similarity
- View pattern frequency and distribution
- Identify recurring issues at a glance
AI Log Summary
- Total log count, rate, and error percentage
- Critical issues with severity ratings
- Root cause identification and impact analysis
Structured JSON Logs
- Expand any log line into a full field-by-field view
- Toggle between table and raw JSON
- Filter on any field with one click, no parsing queries
Cross-Signal Navigation
- Service Graph showing dependencies
- Distributed traces with spans and timing
- CPU and memory metrics at the log timestamp
- All traces filtered by service and timeframe
Trusted by teams like yours

“We switched from CloudWatch, Grafana, and Prometheus to Oodle. Honestly, it’s been a game changer. Having logs, metrics, and alerts all in one place just makes life easier.”
 Ashish GuptaPrincipal Engineer, Fello













Frequently asked questions
What is the best Grafana Loki alternative?
Oodle AI is the managed alternative teams pick when Loki’s label model starts to hurt. It keeps your Grafana dashboards and shipping agents, adds true full-text search with no LogQL and no cardinality limits, and prices everything on one meter: $0.30/GB ingested. Most teams connect in 2-3 hours and validate within a day or two.
Is Grafana Loki reliable at scale?
At moderate volume with disciplined labels, yes. At scale, teams report query timeouts, inconsistent counts between identical queries, and the 128KB line cap silently truncating logs. Oodle AI’s serverless, columnar architecture removes those bottlenecks: no line caps, no label-dependent performance, consistent results as volume grows.
Why is our Grafana Cloud bill so hard to predict?
Because five meters run at once: ingest, storage, query scanning, active series, and per-user seats. The active-series meter is the wild card; one team put it plainly: “the costs for active series are impossible to predict.” Oodle AI prices one meter, $0.30/GB ingested, with everything else included.
How do I migrate from Grafana Cloud Loki to Oodle AI?
Three steps. Dual-feed logs to Oodle AI next to Loki with Vector, Fluentd, or OTel; no application changes (setup guides). Validate side by side and import your Grafana dashboards. Then cut over. Most teams connect in 2-3 hours and validate within a day or two.
How does Oodle AI compare with other Loki alternatives?
Self-hosted ELK gives you full-text search but hands you a cluster to run (see the ELK comparison). CloudWatch avoids the ops but bills every query scan (see the CloudWatch comparison). Oodle AI is the managed option with click-based search and one flat meter.