On This Page
Grafana Labs to Oodle AI Migration Guide
Risk-Free Migration. 3x Cost Savings. Superior DevEx.
Plus, AI-powered debugging helps teams resolve incidents faster.
For detailed comparisons: Grafana Managed Metrics | Grafana Managed Loki
"It took less than 6 hours including calls to achieve 3x cost reduction."
Kunal Khandelwal
Platform Engineering Lead, CureFit

"Switching to Oodle AI was seamless and efficient as we moved away from Grafana Labs."
Nilesh Bansal
Co-founder and CTO, Workorb
Reliability
99.9% availability guarantee
< 1 minute ingestion latency for Logs, Metrics and Traces
Security
ISO, SOC2 Type2 & GDPR compliant
RBAC & SSO/SAML integration
Single-tenant deployment option
24x7 Support
Response SLA:
Critical: 15m | High: ~1h | Other: <1d
Private Slack, Intercom & Email
"The best thing about Oodle is the team. They're always there to help out." - Suman, CTO, Fello AI
Trusted by Public companies, Unicorns and high-growth startups


Migration Journey
Run both systems in parallel, verify everything works, then switch.
Ingestion & Setup
⏱️ 2 hours for 1 engineer
✅ Configure double-write
✅ 1-click dashboards & alerts import
Verification
⏱️ 2 weeks (calendar time), ~1 day per team
✅ Validate dashboards
✅ Test queries & alerts
Cutover
⏱️ 2 hours for 1 engineer
✅ Activate Oodle alerts
✅ Stop Grafana ingestion
Ingestion & Setup
Effort: 2 hours for 1 engineer
Overview
In this phase, you'll configure your observability agents to send data to both Grafana and Oodle simultaneously. This double-write approach ensures zero risk - your existing Grafana setup remains unchanged while you validate Oodle in parallel.
Key benefit: Continue using your current agents (Prometheus, Vector, OTel). No new agents to deploy.
Prerequisites
- Access to update exporters
- Grafana URL & API Key
- AlertManager yaml/url
- Docker installed
1.a Configure Double-Write
Add Oodle as an additional destination for your observability data.
Metrics
- Prometheus Remote-Write: Add Oodle as an additional remote write endpoint to
prometheus.yml:remote_write: - url: https://<OODLE_ENDPOINT>/v1/prometheus/<INSTANCE_ID>/write name: oodle-remote-write headers: X-API-KEY: <API_KEY> - OTel: Send metrics via OpenTelemetry
- CloudWatch: Direct integration for AWS metrics
- Grafana Alloy Agent: Native support for Grafana agents
- Grafana Pre-built Integrations: Kubernetes, MySQL, PostgreSQL, MongoDB, Redis, Elasticsearch, NGINX, Apache, HAProxy, AWS, GCP, Azure, Kafka, RabbitMQ, and 100+ more
Logs
- Vector: Add the following configuration to your Vector configuration file:
sinks: oodle: type: http inputs: [<sources...>] uri: https://<OODLE_ENDPOINT>/ingest/v1/logs encoding: codec: json compression: gzip request: headers: X-OODLE-INSTANCE: "<OODLE_INSTANCE>" X-API-KEY: "<OODLE_API_KEY>" retry_attempts: 3 timeout_secs: 60 - Fluent Bit: Configure Fluent Bit to send logs to Oodle endpoint
- Fluentd: Configure Fluentd to send logs to Oodle endpoint
- OTel: Use OpenTelemetry for log ingestion
- Kubernetes: Direct K8s log integration
- Promtail: Run parallel Promtail instance
- AWS CloudWatch Logs: Direct CloudWatch integration
Traces
- OTel: Add Oodle exporter to OTel Config file:
exporters: otlphttp/oodle: traces_endpoint: "https://<OODLE_INSTANCE>.collector.oodle.ai/v1/otlp/traces" headers: "X-OODLE-INSTANCE": "<OODLE_INSTANCE>" "X-API-KEY": "<OODLE_API_KEY>" - Grafana Alloy Agent: Native support for Grafana trace collection
- Direct SDK Configuration: Language-specific SDKs (Go, Java, Python, Node.js, etc.)
1.b Migration
Migrate your existing Grafana dashboards and alerts with a 1-click import process.
Dashboards
What gets imported: All datasources, panel configurations, visualizations, variables, annotations, dashboard organization, folders, time ranges, and refresh intervals.
- Navigate to Settings → Integrations → Grafana in Oodle
- Enter the Grafana instance URL
- Enter the Grafana Service token key
- Run docker command
- All dashboards and datasources are listed with their import status.
- Any pending configurations are flagged with instructions to fix & retry where applicable
Note: Loki dashboards are not supported for automated import at the moment. Oodle team will handle these migrations end-to-end for you.
Alerts
What gets imported: Alert rule definitions and thresholds, evaluation intervals, notification policies, severity levels, labels, and annotations.
If you are using Grafana alerts, they are imported along with the dashboards.
Oodle supports alerts in Terraform. If you'd like to migrate to alerts-as-code, our team will help you set it up. Learn more.
If you are using Prometheus AlertManager:
- Navigate to Settings → Integrations → AlertManager Alerts
- Share
prometheus.yml&alertmanager.ymlfiles - Alternatively, share a Prometheus instance URL & AlertManager URL for Oodle to scrape the alerts
Tip: Configure Oodle alerts to send to a separate Slack channel so you can compare alert behavior side-by-side before switching over.
Verification
Effort: 2 weeks calendar time, ~1 day per team
In this phase, the teams verify ingestion of all telemetry signals, dashboards, and alerts. Usually, the DevOps/Platform teams verify basic ingestion and critical dashboards, logs, & traces first. The verification is then passed on to individual application teams to verify their own dashboards and telemetry signals are working as expected.
The bulk of the time is coordination and asynchronous review, not hands-on work.
P.S. For larger companies with dozens of teams, it can be done under a month.
Week 1: DevOps & Platform Teams
- Compare metric cardinality and data points
- Spot-check high-priority dashboards, critical logs and traces
- Run sample queries in both systems
- Review if alert rules are being evaluated correctly (in test mode)
Week 2: Application Teams
- Each app team reviews their dashboards in Oodle
- Verify Log queries
- Verify request flows on distributed traces
- Check if alerts fire correctly (in parallel with Grafana)
Turn Off Grafana Labs
Effort: 2 hours for 1 engineer
Once verification is complete and your team is confident, it's time for the final cutover. This is straightforward and reversible if needed.
Prerequisites
- Alert notifications are working as expected
- All critical dashboards validated in Oodle
- Ensure sufficient historical data is available by
- Double-writing for longer before cutover.
- Request Oodle for a back-fill.
1. Activate Oodle Alerts
Change alert status by updating the notifiers and state
2. Deactivate Grafana Alerts
In Grafana/AlertManager, silence or disable alert rules to prevent alert storms during transition
3. Switch to Single-Write
Remove configs writing to Grafana Cloud for all telemetry signals
4. End Grafana Labs Subscription
Cancel your Grafana Cloud subscription and remove individual user licenses
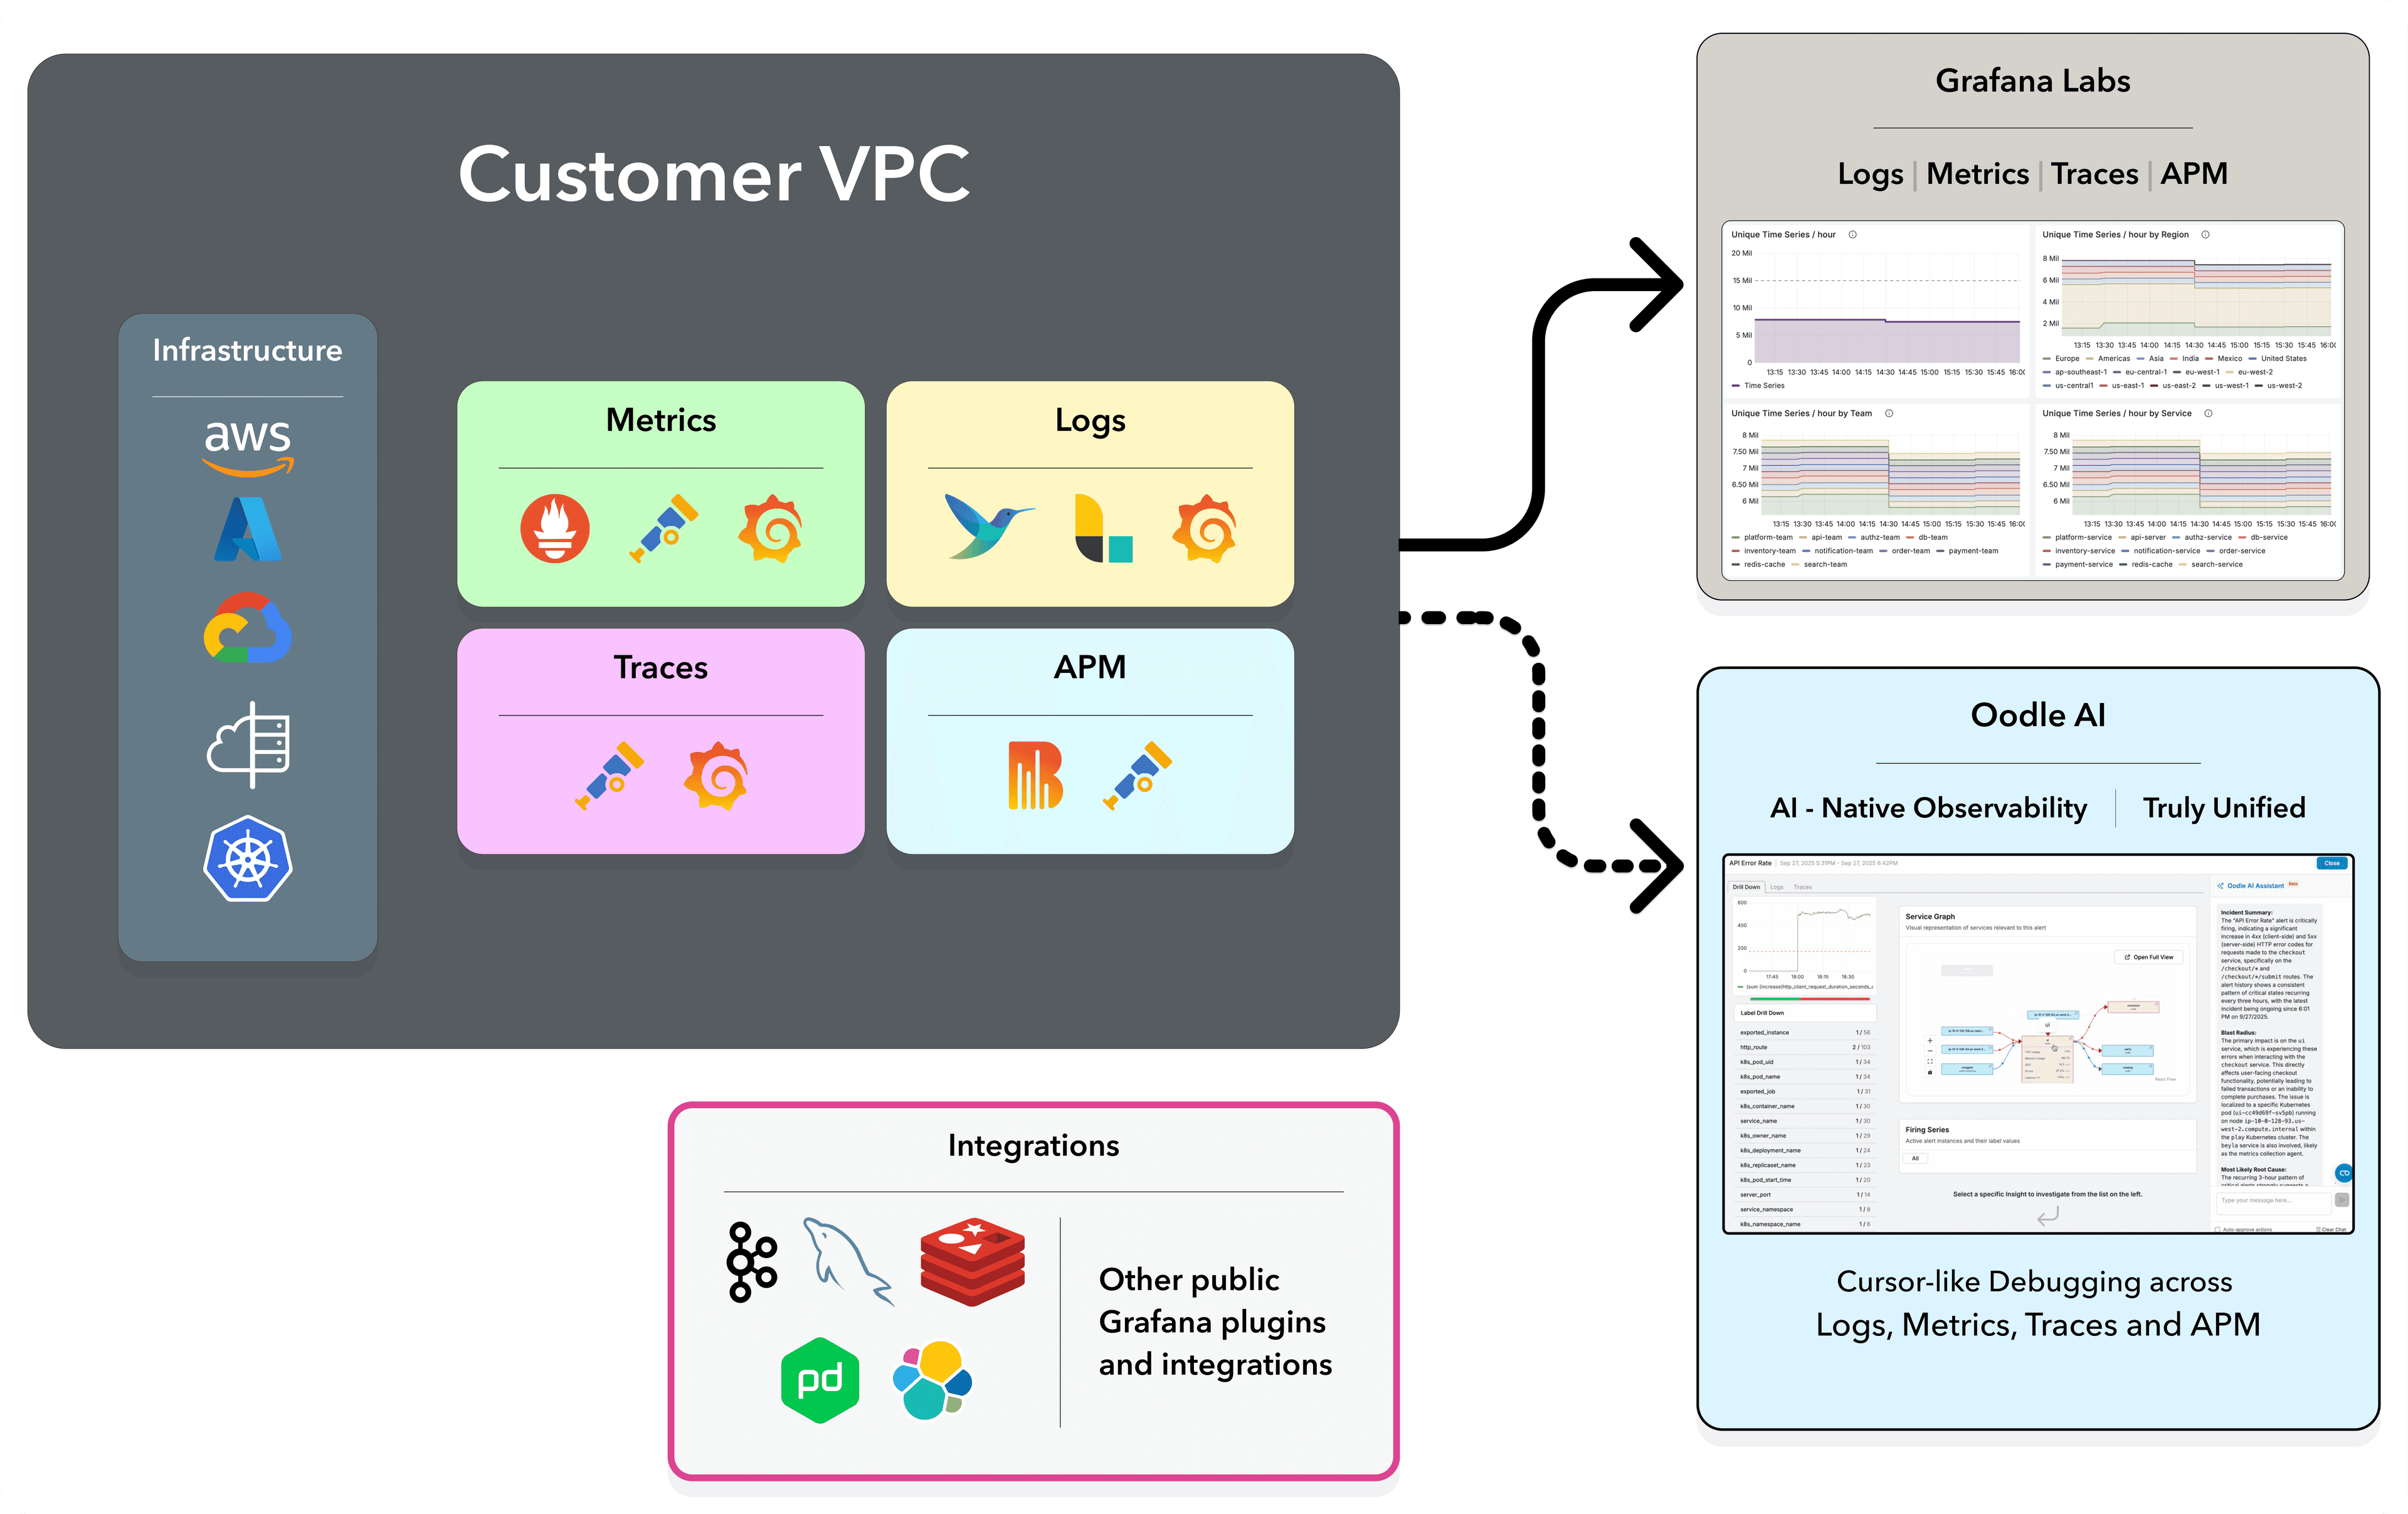
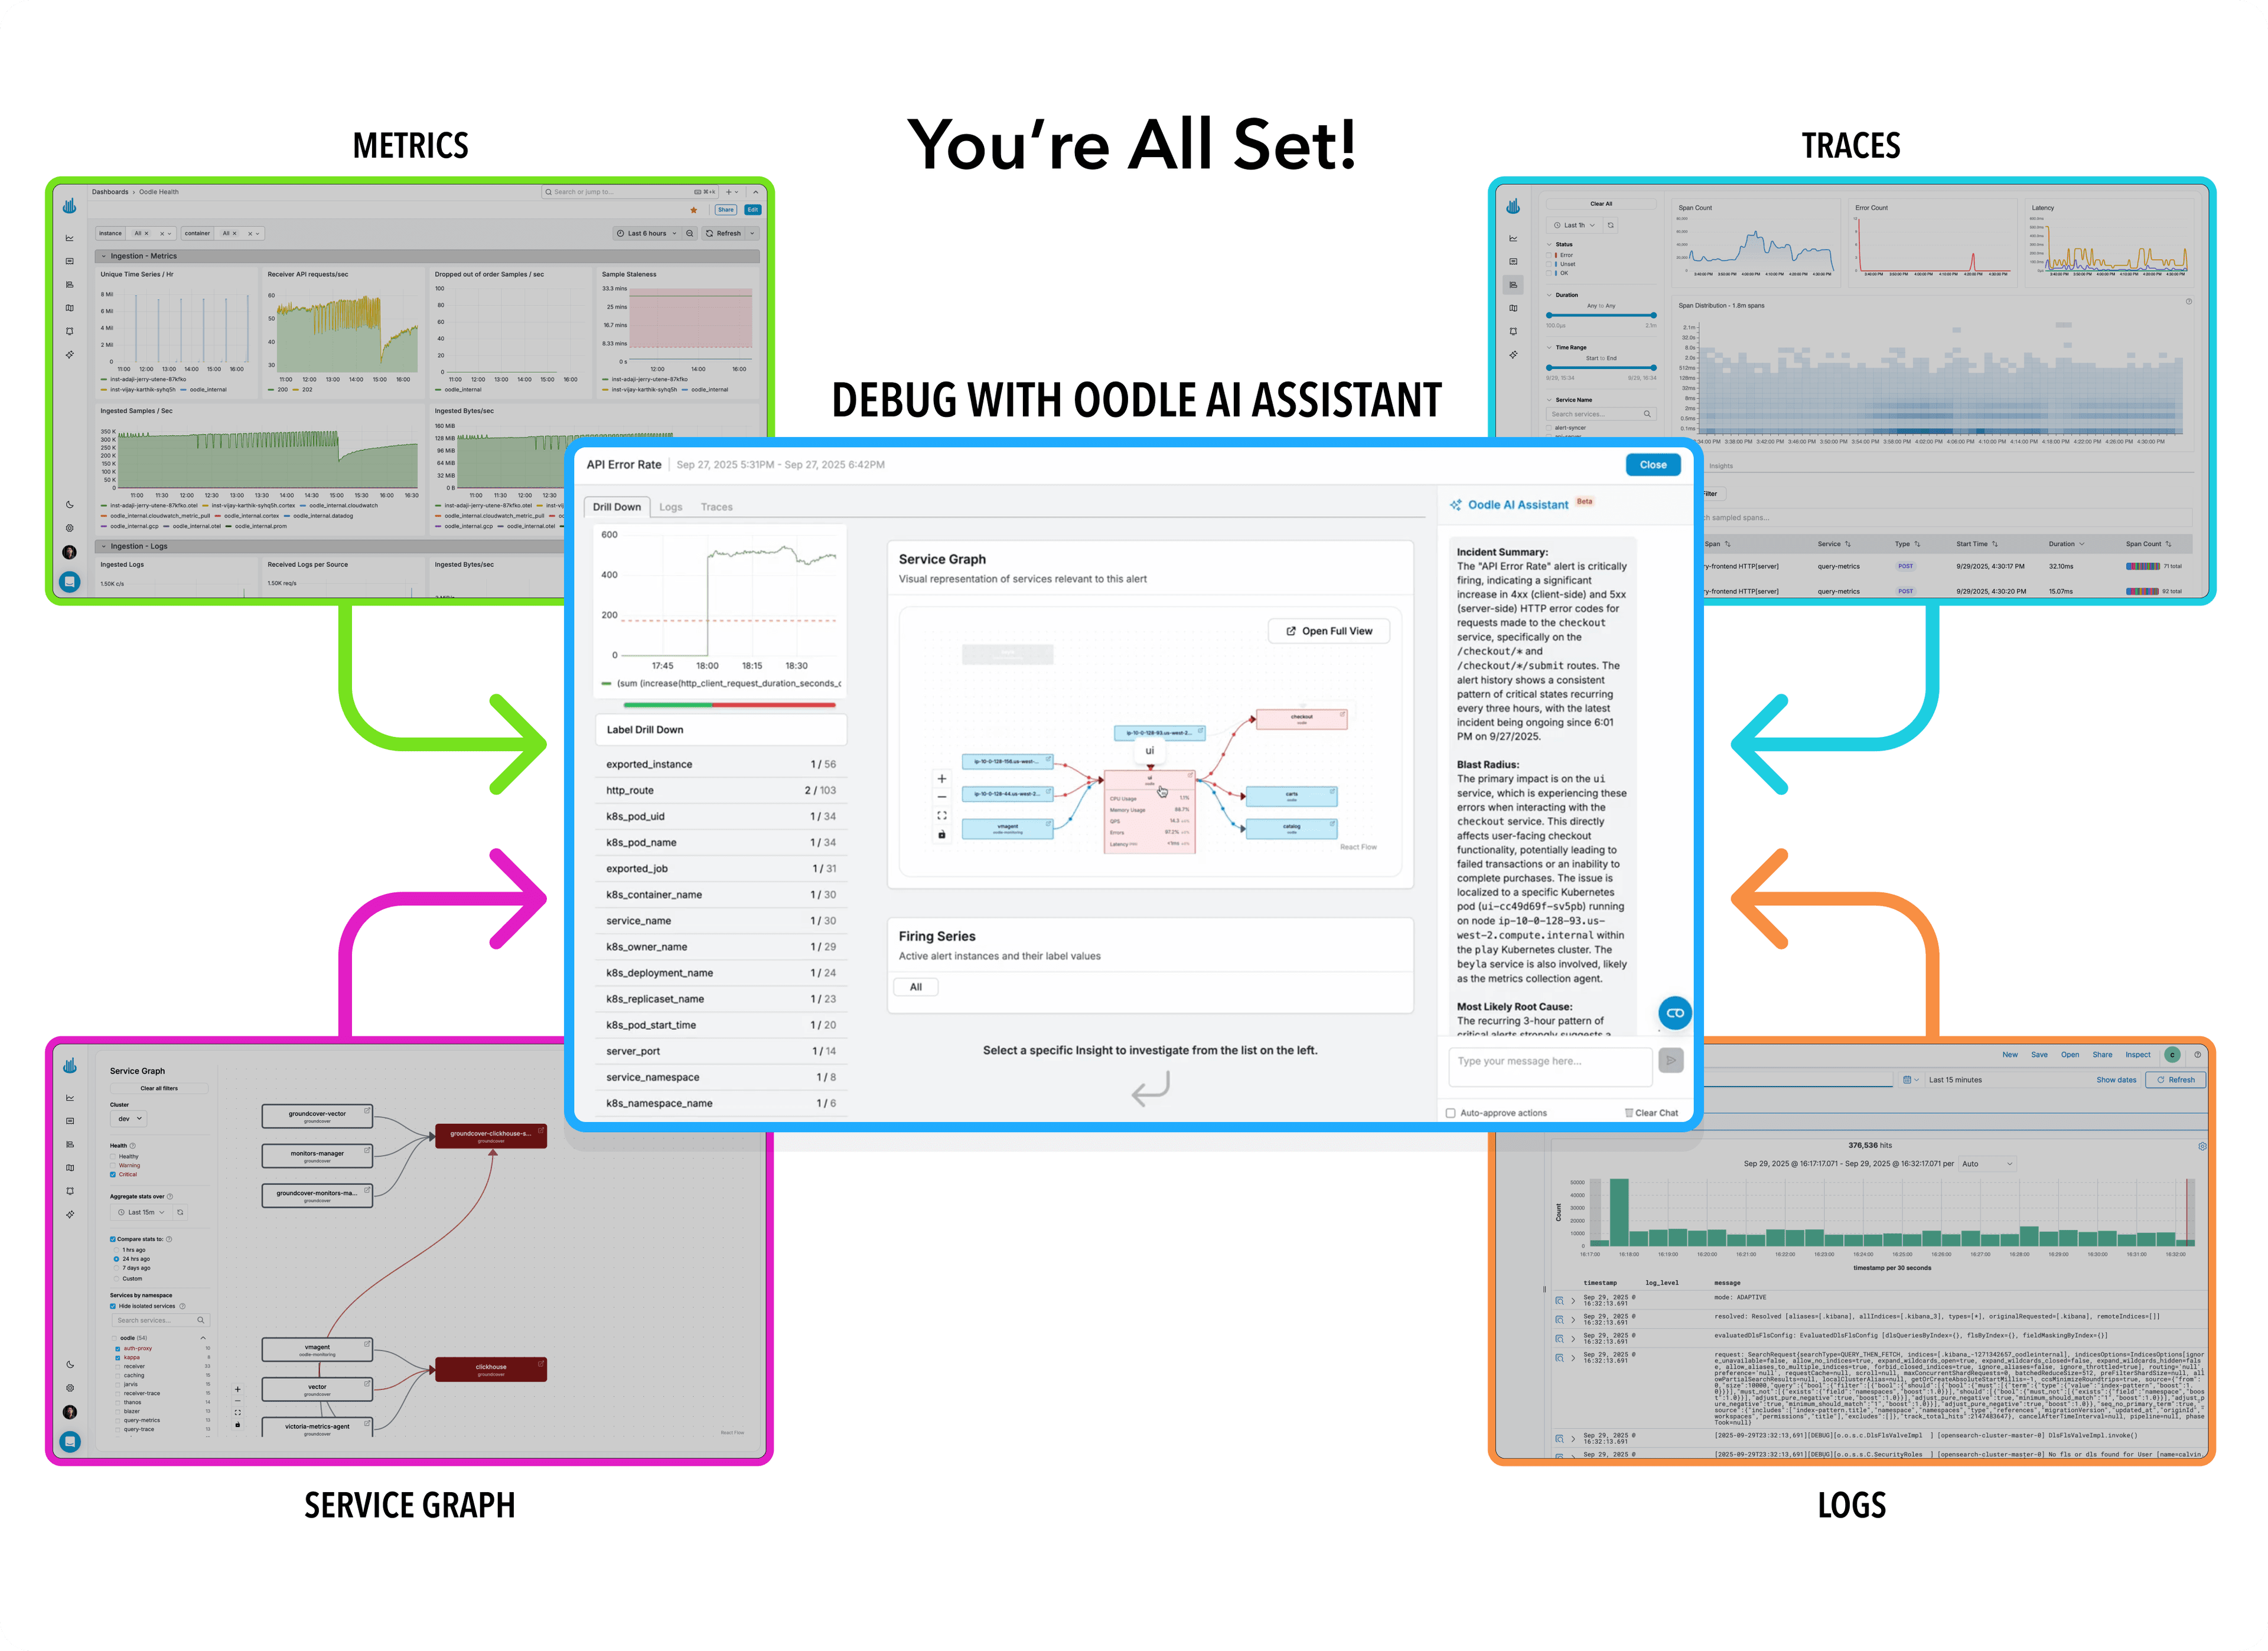
Experience AI-Native Unified Observability
Everything Unified
- Metrics, logs, traces, and Service Graph in a single interface
- All your dashboards, preserved and working
- All your alerts, firing reliably
- No more jumping between Grafana, Loki, and Tempo
- Automatic correlation across all data types
AI-Native Debugging
- Ask questions in plain English: "Which services are impacted?"
- AI surfaces relevant logs, traces, and metric anomalies automatically
- Proactive anomaly detection catches issues before alerts fire
- It's like having Cursor for debugging production
Frequently Asked Questions
Common questions about migrating from Grafana Labs to Oodle AI
Do Oodle have integrations with AWS and GCP?
Does Oodle support Grafana integrations?
How does duration vary based on my company size?
I just want 1 of the 4 signals (metrics, logs, traces, or service graph)
I have a lot of custom metrics and high cardinality
Do you support Grafana plugins and custom visualizations?
Will I get cost attribution and usage attribution capabilities?
How can I migrate out of Oodle?
Ready to Elevate your Observability?
Your dev/test environment will be sending data to Oodle before our first call wraps up.