“Cursor-like debugging has transformed how we make decisions.”
Ramakrishna R
Co-founder and CTO, Cureskin
9 petabytesof production telemetry last quarter9 petabytesof production telemetry last quarter —no sampling
Built by engineers behindRubrikAmazon S3DynamoDBSnowflake

Nagendra Swamy
VP Engineering
Lookout
Cybersecurity leader, trusted by 2k+ enterprises
“We’d used Datadog for eight years and we never thought we could easily switch until Oodle proved otherwise. They migrated thousands of nodes, dashboards, and alerts in weeks. Performance improved, costs dropped, and they’ve been a dependable, transparent partner.
Legacy disk-backed, fixed-compute stacks were built for humans on dashboards - not AI agents issuing thousands of parallel queries over full-fidelity telemetry. They force a choice: sample your data, shorten retention, or pay more for infrastructure.
Sampling exists because legacy observability makes storing everything too expensive. Always-on compute and indexing pipelines drive 5× higher costs.
Legacy architectures were built for dashboard users, not parallel agent queries.
Agents expect instant answers. Legacy systems were built for interactive UI.
Object storage for data. Serverless compute for queries. No disks. No clusters. No operational overhead. Storage and compute scale independently, eliminating the traditional tradeoffs between retention, performance, and cost.
Explore the technologyTelemetry stored directly on object storage.
Separate storage and compute. No rehydration. No indexing pipelines.
Serverless query execution that scales instantly.
No disks. No clusters. No ops overhead.
Full-fidelity telemetry. No sampling at production volume.
No signup. No gates. Every feature visible.
30M+ metrics500GB+ logs10GB+ traces daily
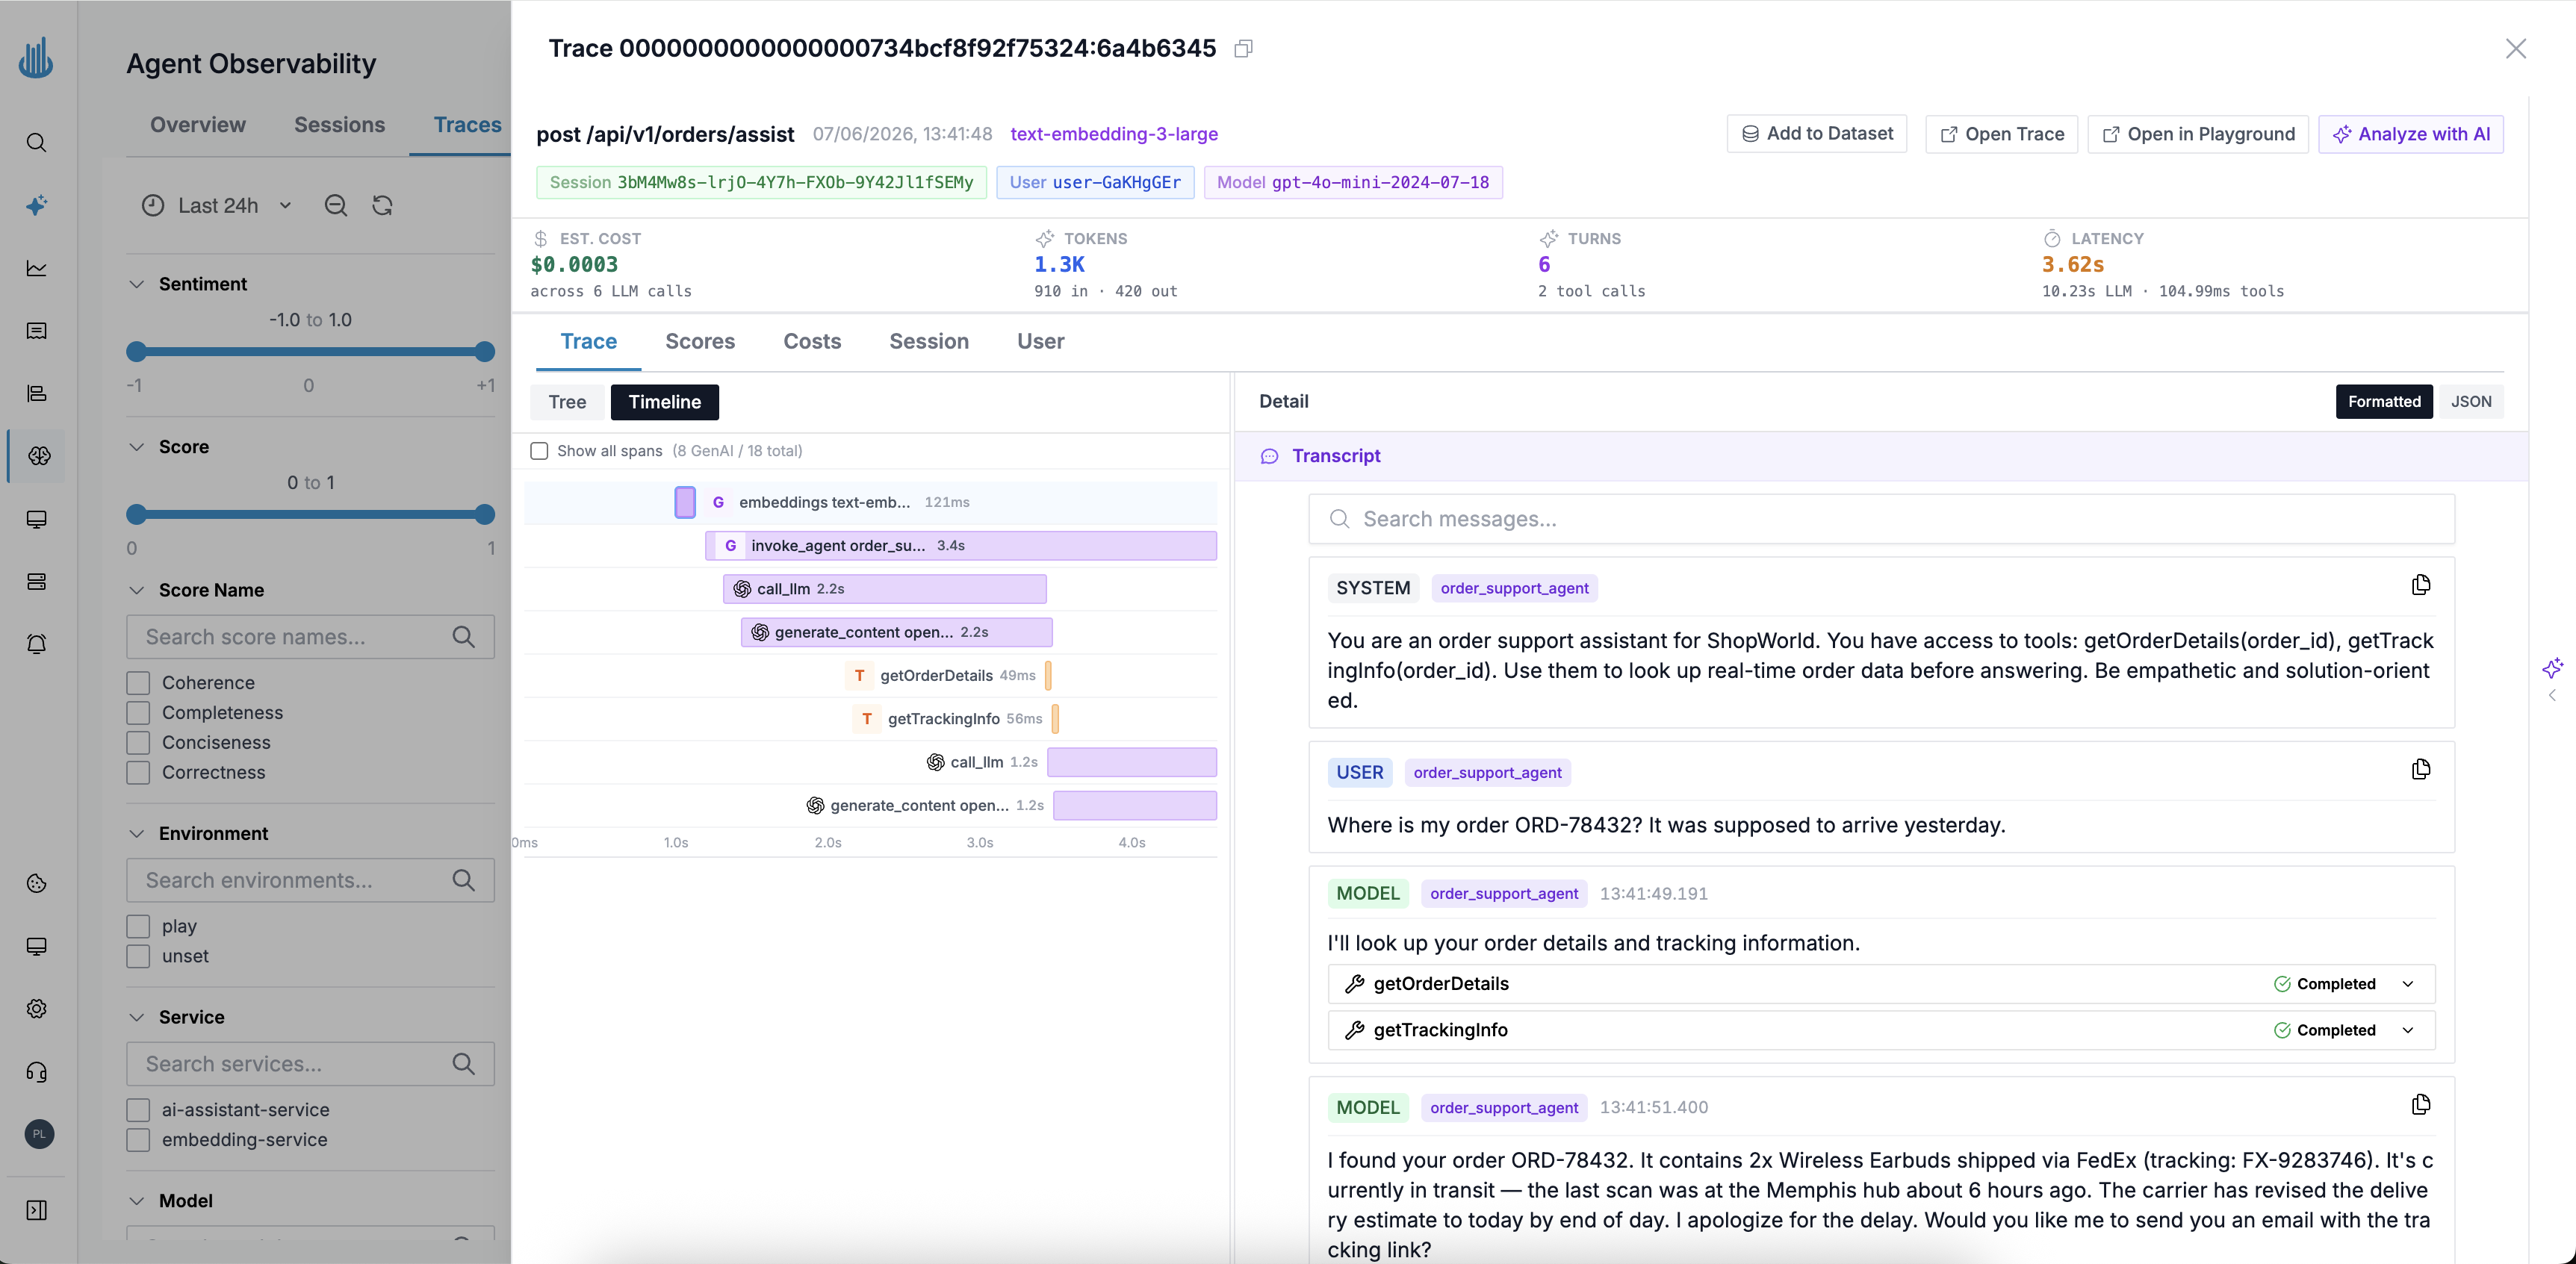
Ask questions in plain English directly from Cursor, Claude, AI assistant or Slack
Trace prompts, tool calls, model latency, cost, and quality across LLM apps and agents.
Here's the line-item math at 100GB logs/day, 50GB traces/day, 500K active time series
| Item | Rate | Cost/mo |
|---|---|---|
| Logs1.6KB/event | $2.50/M events | $5,033 |
| Traces150GB + 1M spans free/APM host · 30d indexed retention · 1M spans ≈ 10GB | $0.10/GB ingested + $2.50/M indexed | $438 |
| Metrics | $5-$1/100 custom metrics (tiered) | $5,000 |
| Hosts | $15/infra + $31/APM host | $230 |
| Containers5 free/host | $0.001/container-hr | $55 |
| Total | $10,756 |
| Item | Rate | Cost/mo |
|---|---|---|
| Data Ingested (Logs + Traces) | $0.30/GB | $1,350 |
| Metrics | $2.00/1K ATS/hr/mo | $1,000 |
| Total | $2,350 |
30 days retention included at no extra charge. Increase retention above 30d to see additional storage cost.
*Metrics: 1 sample per time series every 60s (ATS = active time series / hour). Retention: 30 days included; additional storage billed at $0.001/GB-month. Usage rates shown; see plans above for minimum commitments.
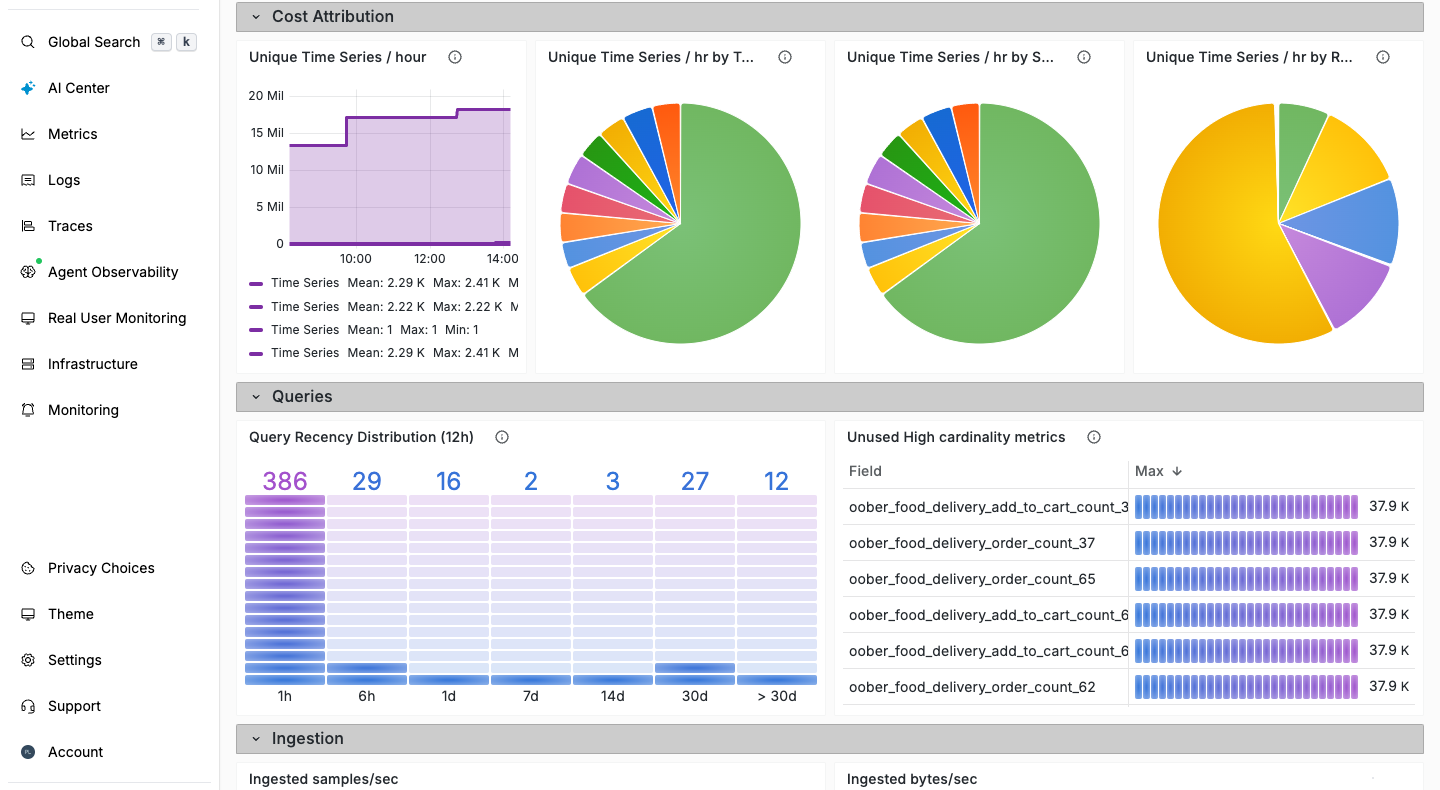
See spend by team, service, and region—for logs and metrics.
Keep your existing agents, dashboards, alerts, and queries. Run both systems in parallel until you're confident, then cut over. Typically, Elastic and Grafana in < 1 day; Datadog in 2–4 weeks.
Step 01
Point existing agents at Oodle. No code changes required.
Step 02
1-click dashboard and alert import. PromQL, Lucene, and OTel queries work immediately.
Step 03
Compare results on your schedule. Cut over only when your team is satisfied.
Step 04
Turn off the old stack on your timeline-no forced deadline.
Native Grafana UI for metrics dashboards and alerts
Familiar log explorer with full-text search
Your existing queries work immediately
Native OTel support for all signals
Zero vendor lock-in. Your data lives on standard formats, your queries use 100% open standards. Oodle earns your business by being better - not by making it painful to leave.
View migration guidesPick the model that matches your compliance requirements. All three are SOC 2 Type II, ISO 27001, and GDPR compliant.
Oodle manages everything. Fastest path to production. Best for teams that want zero infrastructure overhead.
Oodle processes your data. Storage lives in your S3 buckets. You own everything at rest.
Full Oodle stack in your VPC. No data leaves your network perimeter. Ever.
Speed
“MCP server is a game changer. Engineers ask from Cursor or Oodle AI Assistant.”
Efficiency
“10 years of Datadog replaced in 6 weeks. Thousands of nodes, 2000+ alerts, and 300+ dashboards.”
 6-week migration
Simplicity
“20TB/day. 5× faster than Elasticsearch. Developers switched to Oodle from day 2 and never looked back.”
 2 week migration
Trusted by a cybersecurity leader serving 2,000+ enterprises including Fortune 500 and federal organizations.
Read the full case study“60–70% debugging time reduced.”
Engineering Lead
Brackett AI
“CloudWatch reliability. OpenSearch simplicity. Oodle gave us both.”
Brandon Kite
CTO, Fuel
“Setup was a breeze. No hours wasted like with other platforms.”
Anupam Dev G.
Lead Application Architect, HappyPath
“Combining logs and metrics cut our MTTR in half.”
Aneesh Adhikari
Engineer, Bedrock Data
“Cursor-like debugging has transformed how we make decisions.”
Ramakrishna R
Co-founder and CTO, Cureskin
“Give me the RCA. Boom.”
Priyank Raj
Sr Software Engineer, Labra
Your AI agent discovers your environment, deploys Oodle, and starts flowing telemetry automatically. No YAML editing, no cluster provisioning, no ops calls.
Try agentic onboardingAdd the Oodle skill pack to your AI agent.
In your agent chat, run the onboarding command:
Your data is flowing. Try one:
Discovering your environment...
Found Kubernetes cluster production - 12 nodes, 47 pods. Helm is used to deploy resources.
Deploying monitoring stack:
helm upgrade --install \
  oodle-observability \
  oodle/oodle-k8s-observability \
  --values oodle-values.yaml \
  --namespace oodle-monitoring \
  --create-namespace --wait


