How Fuel Labs unified monitoring across environments and enabled early issue detection

Unified
across environments. Replaced 4 tools.
50%
Savings on logs + metrics costs
< 30min
Logs onboarding time
Zero
Management overhead. 25% DevOps productivity boost

Fuel is a blockchain startup trading $1B+ in annual volume.
Mike, Engineering Leader, and Brandon, CTO at Fuel Labs, share their journey from monitoring chaos to unified observability.
Challenge
“We had to juggle retention across OpenSearch and CloudWatch. Yet, logs were not reliable and queries were slow.”
Brandon, CTO
“We couldn't compare metrics from across environments, accounts, and k8s clusters easily to see regressions or improvements.”
Mike, Engineering Leader
Fuel was being held back by monitoring chaos. Despite building cutting-edge infrastructure, their observability stack couldn't keep pace with their growth.
Pain Points:
Scattered Tooling: Grafana, OpenSearch, and CloudWatch created a fragmented developer experience.
Unreliable Logs: Critical logs went missing during incidents due to scaling limits.
Rising Costs: Duplicating full monitoring stacks in every environment drove expenses up.
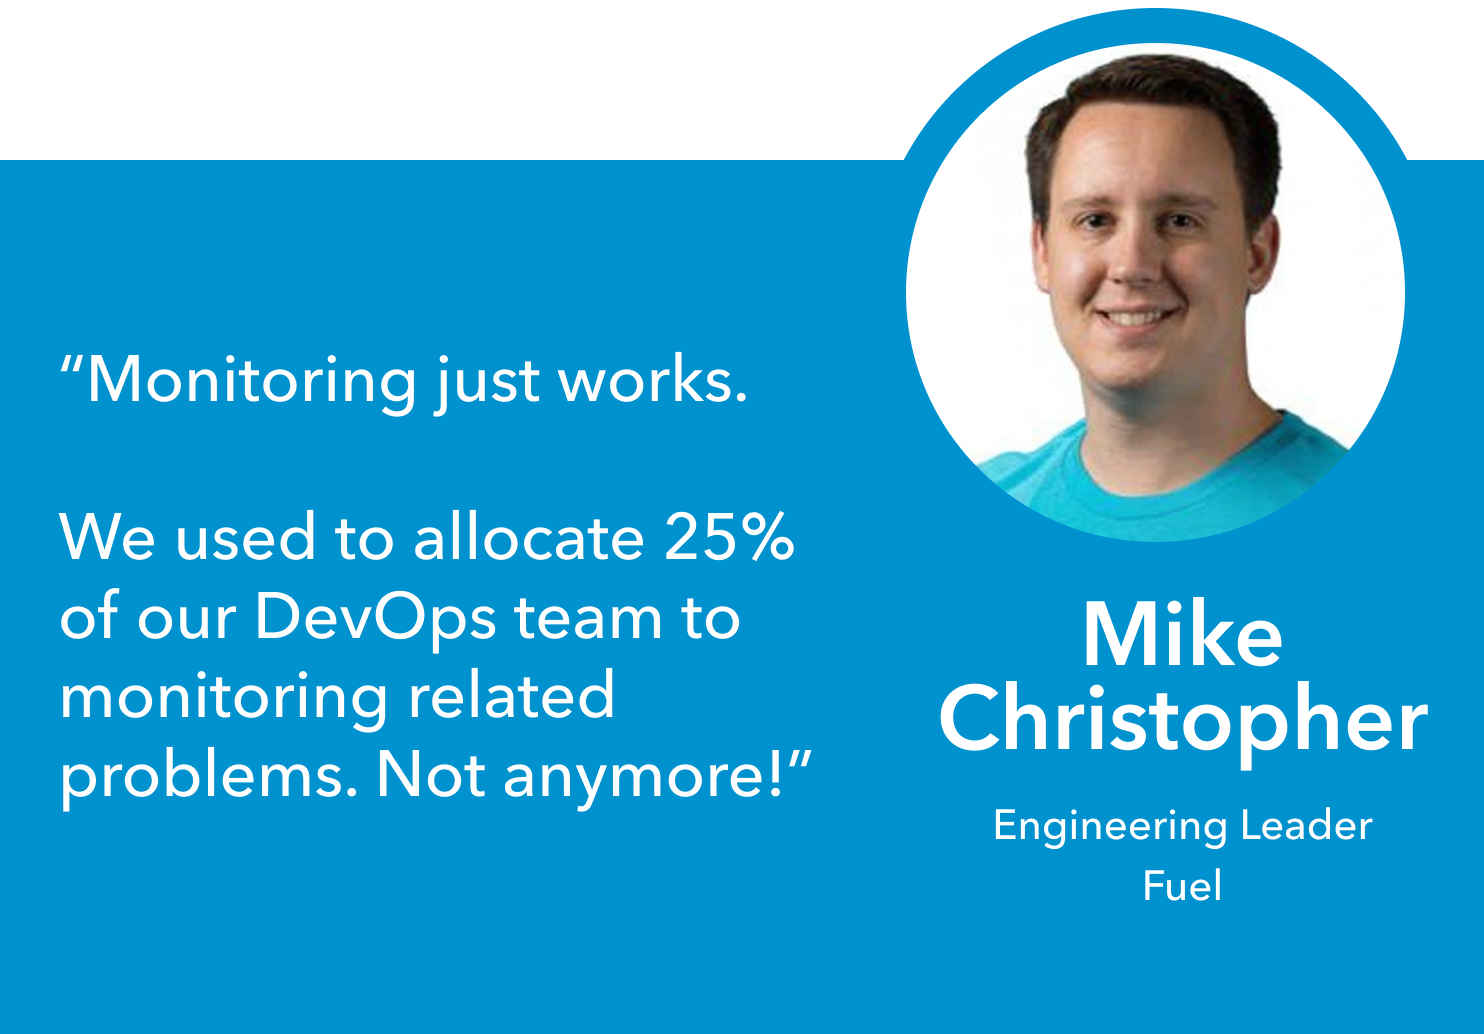
Heavy Ops Load: 25% of DevOps time spent on running Prometheus, Grafana and managing log reliability/retention.
Solution
Why Fuel Chose Oodle Over Self-Hosting
“Oodle made it easier to identify issues earlier in the development life cycle.
We can compare across environments in a way that we couldn't earlier.”
Mike, Engineering Leader
“I wanted a single pane of glass and remove management overhead as we started scaling.”
Mike, Engineering Leader
Fuel chose expertise over DIY. They found a team that obsessed over monitoring so they could focus on blockchain innovation.
What made the difference:
Fully managed: No more index management, upgrades, scaling, or other operational headaches.
Cost-efficient: 50% cheaper, S3 backend architecture, affordable.
Familiar interface: Zero learning curve with Grafana and OpenSearch UI
Single pane of glass: Unified metrics, logs and alerting across environments.
High Performance: Fast and reliable queries.
Impact
Focus on Blockchain, Not Monitoring
“We'd been juggling CloudWatch and OpenSearch — one was reliable but painful, the other easier but flaky. With Oodle, we got the best of both. The setup is quick, queries are fast and it just works!”
Brandon, CTO
50% cost savings: Better product with lower costs
Reliable monitoring with zero management overhead: It just works
25% DevOps productivity boost: Focus shifted from monitoring problems to core business
Early issue detection: Cross-environment visibility helps identify regressions early
“Our engineers are loving the single pane of glass with Oodle. The usage and cost attribution features are right there, that's wonderful!”
Mike, Engineering Leader
Experience monitoring that lets you focus on what makes your business unique.
Request a Demo →